Representing An Organization within an SQL
Database
This article discusses different methods of representing an organisation
structure within a SQL database. The article highlights the inherent flaws
in a simple approach and goes on to recommend segregating the hierarchy from the
people.
Starting with A Simple Data Structure
To define an organization chart many
people start with a data table that represents the organisation as a hierarchy
of people as show in figure 1.
|
UniqueId
|
Name
|
ManagerId
|
JobTitleId
|
|
1
|
Boss
|
0
|
1
|
|
2
|
Worker1
|
1
|
2
|
|
3
|
Worker2
|
1
|
2
|
|
4
|
Worker1-1
|
2
|
3
|
|
5
|
Worker1-2
|
2
|
3
|
Fig
1. Person Table
By using a simple SQL statement joining
the “JobTitle” ( shown in Figure 2 )
table to the “Person” table and the OrgChartComponent it would be trivial to produce a
simple organisation chart that would look liked the one in figure 3.
|
JobTitleId
|
JobTitle
|
|
1
|
CEO
|
|
2
|
Director
|
|
3
|
Staff
|
Fig2. JobTitle Table
|

|
|
Fig
3. A Basic Organisation Chart
|
Focus On the Roles
Whilst adequate for simple organizational
structures that are relatively static this traditional approach has a number of
weaknesses including;
·
How is a
vacant position represented?
·
How would
the structure cope if an individual either managed or was a member of two teams?
·
How does
the structure cope if an individual moves or leaves the organisation?
An alternative to this is to focus on the
roles and not the people within the
organization. The organisation can
be viewed as a hierarchy of roles that are occupied by people rather than a
hierarchy of people performing roles.
To do this we must separate the people
from the roles.
First we create a simplified “People” table that just contains
staff data. For the purpose of this
article we are limiting the data to just name in real-life the table could
contain other information such as telephone number or email address.
|
PersonId
|
Name
|
|
1
|
Boss
|
|
2
|
Worker1
|
|
3
|
Worker2
|
|
4
|
Worker1-1
|
|
5
|
Worker1-2
|
Fig
4. Modified Person Table
And now we represent the hierarchy as a
collection of roles which we store in the “Organisation” table. Shown in
figure 5.
|
OrganisationId
|
PersonId
|
ReportsToRoleId
|
JobTitleId
|
|
1
|
1
|
0
|
1
|
|
2
|
2
|
1
|
2
|
|
3
|
3
|
1
|
2
|
|
4
|
4
|
2
|
3
|
|
5
|
5
|
2
|
3
|
Fig
5. Organisation Table
Using basic SQL and the OrgChartComponent
we could now present the chart to the users.
However if we did you would no doubt notice that it is
exactly the same as the first chart!
This is because although we have changed the underlying storage
representation we have not yet added any additional features to the chart.
Enhancing the Organisation Table
So far we have not gained anything over
the first approach but the added flexibility of separating the roles from the
people using the “Organisation” table
to represent the hierarchy becomes apparent when we start to enhance the
functionality available to us.
If we wished to represent some positions
as “Part-Time”,
“Full-Time”, “Job Share” or
“Graduate” we could add a
“PositionType” field to the table.
We may also wish to add an “IsVacant” flag to the table to
indicate that the position is waiting to be filled.
Finally we can allow the same “PersonId” to be present more than
once in the “Organisation” table.
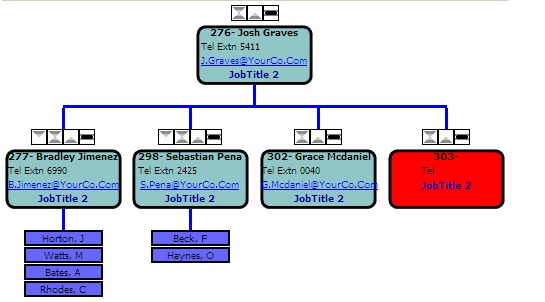
Now we can start using the
OrgChartComponent to implement the additional features for example, we could
fill any vacant positions as red as show in figure 6.
|

|
|
Fig 6. Highlighting vacant positions
|
Taking it further
There are a lot of advanced features that
become easily implementable once you decide to separate the people from the
hierarchy.
For example one could easily imagine
adding an “On Vacation” flag to the
table and using that to indicate which staff members were on holiday. It also then becomes possible
to present multiple hierarchies and to use this in “what-if” analysis scenarios.
It becomes possible to present matrix
organisations in an accessible manner and opens up the possibilities of
performing significant statistical analysis upon the workforce.
Figure 7 below shows a screen shot taken from the OrgChartComponent starter kit
that has been implmented using these techniques.
Fig
7. The OrgChartComponent Starter Kit
I will expand on the subject of matrix
organisations in a future article.
Organisation chart starter kit
The OrgChartComponent starter kit contains
a demonstration version of the OrgChartComponent, a simple ASP.NET website that
displays an organisation chart and a SQL Express database that holds the data of
a factious organisation of 300 “people”.
The database uses three tables,
job titles, staff and
Organisation to hold the organisation
chart.
The starter kit can be downloaded from
http://www.orgchartcomponent.com/download.aspx